The Salesian Polytechnic University (UPS) Cuenca, through its research groups, is constantly seeking to link its students with the field and the use of the latest technologies.
In this context, the Research and Development Group in Industrial Technologies (GIDTEC) has been working for several years on models to diagnose bearings and coupling failures in rotating machinery through vibration analysis using traditional techniques. As a result of this work, GIDTEC has achieved publications in high impact journals worldwide and cooperative working relationships with public and private institutions in different parts of the world.
ERBESSD INSTRUMENTS® is dedicated to the manufacture of equipment and instruments for condition monitoring. In the international context, through a cooperation agreement with the Salesian Polytechnic University, it has been working on vibration analysis using new techniques that do not need to be in direct contact with the machine or equipment to be analyzed.
Step 1 - Identify the Problem
Non-contact Vibration Analysis
The condition monitoring techniques, such as the use of the accelerometer and acoustic emissions need to be in contact with the surface of the machine to be analyzed, making these techniques inaccessible and complex on certain occasions and when mounting the sensors due to the conditions of the environment where the analyzed machine is located. This is why non-invasive analysis is a suitable alternative for the user to monitor the condition of the machinery in real time and without being in contact with the machine.
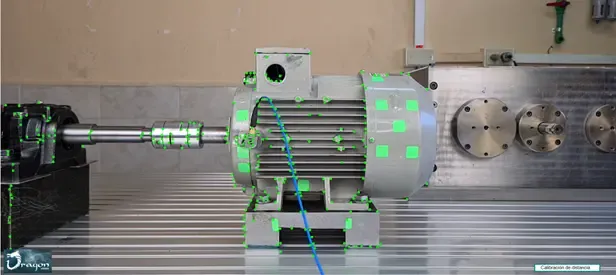
For condition monitoring, the Samsung Galaxy S20+ mobile device was used, in which the user recorded a video and determined the characteristic spectra associated with failures in the SKF 1207 EKTN9 bearing components (inner race, outer race, and rolling elements), as in the vibration bench coupling using Dragon Vision® software owned by ERBESSD INSTRUMENTS®.
During the target selection process, the user identified the areas of movement with the software, being these areas in some cases coincide with the suspicion of where the source of the failure modes in these mechanical components of the GIDTEC vibration bench were occurring.
Step 2 - Technology Application
Transient Conditioning and Video Processing
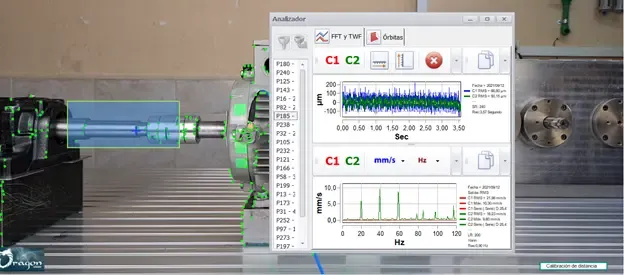
Once the targets and static points have been identified, they went to the “Analysis” tab to indicate at what frame rate the video was acquired in order to process the vibration.
The total video processing time in the Dragon Vision® software was about 28.25 seconds and the total recording time was 3 seconds at 240 fps in FHD. Analyzing this point, the user has spent less than 1 minute to perform the condition monitoring of the GIDTEC vibration bench.
In the “Analysis” tab, once the vibration has been processed, the user proceeds to press the “Show TWF/FFT” button, which visualizes the waveform and vibration spectrum associated with the operating condition of the analyzed machine.
Step 3 - Monitoring Results
Spectra Results of Condition Monitoring of the GIDTEC Vibration Bench
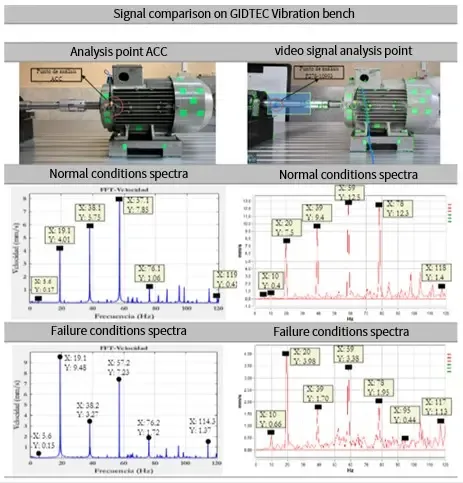
The spectra of the signal under normal conditions acquired by the triaxial accelerometer and the spectra acquired by video signals are presented in Table 1. It is important to notice that the Dragon Vision® software allows visualizing the spectrum in two channels (horizontal and vertical), in this particular case a reference axis will be selected to enable the comparison when faults are implemented in the mechanical elements of the vibration bench.
Table 1. Vibration spectra comparison of under normal and fault conditions of the GIDTEC vibration bench.
Step 4 - Identify the Movement Detection
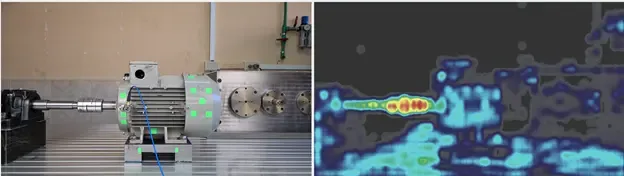
Movement Detection
Once the processing was completed, the motion detection simulation was carried out, whose function allows the user to know the zone with the greatest displacement, and thus facilitate the detection of the moving point to determine the vibration spectrum associated with the fault.