Ten specifications decide the purchase. Four form factors compete for it. The one that ages best is the one not tied to its own hardware.
Short answer. The best vibration analyzer is the one that measures, stores and diagnoses machine vibration today without limiting you in five years. Ten specifications decide it: simultaneous channels, lines of resolution, frequency range, core functions, advanced functions, where the database lives, which sensors it accepts, portability, technical support and total cost over five years. Four form factors compete for the purchase: pen, hand-held, rugged proprietary, and phone/tablet/PC. Only the last one lets you upgrade the processor, the memory and the screen without buying the instrument again. That is why our own analyzer, Digivibe MX®, is built that way.
This guide is the list I would want if I were buying rather than manufacturing. It follows the order in which the decisions actually happen: first what the instrument can capture, then what it can do with the signal, then what you live with for the next five years. The specification that ruins a program is almost never the one on the front of the brochure.
We make vibration analyzers, so read the last section as what it is: our answer to the same list. Everything before it applies whoever you buy from.
What is a vibration analyzer?
A vibration analyzer is an instrument used to measure, store and diagnose the vibration produced by machinery. It uses FFT-based tools to display the magnitude of the vibration as it varies over frequency. Its primary use is to identify and predict faults in industrial machines, as well as the causes that originate them.
Mechanically it is a computer that records vibration through one or more accelerometers. Inside the accelerometer, motion is converted into an electrical current proportional to the acceleration. That signal is digitised and processed to display magnitude against frequency with an algorithm called the FFT — Fast Fourier Transform.
The analyzers worth buying also save those measurements and organise them by machine and by point, so that each reading has a history to be compared against. That capability is what earns them the second name you will see on the datasheets: data collectors.
Analyzer, meter, data collector, monitoring system
Four words get used interchangeably in catalogues and they are not the same instrument:
| Instrument | What it gives you | What it cannot do |
|---|---|---|
| Vibration meter | A number: overall RMS, sometimes an ISO severity band | Tell you what is wrong. There is no spectrum |
| Vibration analyzer | The FFT spectrum and the time waveform, so the fault has a frequency and a name | Keep a history on its own, unless it also collects |
| Vibration data collector | The analyzer plus a machine database and routes, so readings become a trend | Watch the machine when nobody is walking the route |
| Monitoring system | Permanent sensors that measure without anybody present | Replace the analyst for the deep diagnosis |
A meter tells you something changed. An analyzer tells you what changed. A data collector tells you when it started changing. If you are weighing permanent systems rather than a portable instrument, that is a different purchase and we compared four of them in The 4 Best Vibration Monitoring Systems in 2026.
The ten specifications that decide the purchase
The whole list first, then each one in detail. If you read nothing else, this table is the guide:
| What to check | What “good” looks like | How to verify it before you buy |
|---|---|---|
| 1. Simultaneous channels | 4, so a triaxial accelerometer or two balancing planes fit at once | Ask whether channels record simultaneously or are multiplexed |
| 2. Lines of resolution | Enough that you never trade frequency range for resolution | Ask for the maximum LR at the maximum frequency range, not the best case |
| 3. Frequency range | Above the range of the accelerometers, so the sensor is the limit | Divide the sample rate by 2 for the visible spectrum, and by 2.56 for the range where the amplitude is still accurate |
| 4. Core functions | FFT with window functions, waveform, envelope, database, alarms, phase, bearings, reports | Ask which of them cost extra |
| 5. Advanced functions | ODS, modal analysis, run-up and coast-down | Ask for a recording of your machine, not a demo file |
| 6. Where the database lives | Your server, their cloud, or both — your choice | Ask what happens to the history the day you stop paying |
| 7. Sensors it accepts | Accelerometer, velocimeter, displacement probe, tachometer | Oil-film bearings need proximity probes. Check before committing |
| 8. Portability | Field-usable without giving up processor and memory | Hold it. Then ask what the analysis software costs separately |
| 9. Technical support | Free, fast, by telephone, with spares that arrive | Call the support line before you buy and time the answer |
| 10. Total cost | Known for five years, not for the invoice | Ask for licences, annuities, spares and updates in writing |
1. Verify the number of simultaneous input channels
Analyzers on the market carry different channel counts, most commonly 2 to 4.
Recording 2 channels simultaneously is usually enough for balancing, phase analysis, Bode plots and ODS. Triaxial accelerometers and two simultaneous balancing planes, on the other hand, require 4.
Single-channel analyzers are no longer common, because they cannot perform the techniques that some of the most important faults require — misalignment, Bode, balancing.
⚠️ The word that matters is simultaneously. Some instruments advertise four channels and sample them one after another. For phase, that is not four channels: two signals recorded a moment apart have no meaningful phase relationship between them.
2. Understand lines of resolution — and what they are not
The number of lines of resolution defines how many points make up the spectrum. The correct term would be “points”; “lines” survived from audio FFTs, which were plotted as bars.
Lines of resolution are often confused with the resolution of a spectrum, and that is not quite right. The LR count does not know whether the frequency range is wide or narrow, so the same number of lines gives better resolution over a narrower range:
| Lines of resolution | Maximum frequency | Resolution per line |
|---|---|---|
| 6,400 | 10,000 Hz | 1.56 Hz (93 CPM) |
| 6,400 | 1,000 Hz | 0.156 Hz (9.3 CPM) |
The second row has ten times the resolution of the first. You go looking for that precision when you need to separate two frequencies that sit close together.
Picture a fan driven by pulleys of very similar diameter, so the two shafts turn a few RPM apart. To tell the motor’s unbalance from the fan’s, you need enough resolution for the two frequencies to appear as independent peaks and for each amplitude to be measurable. With a ceiling of 6,400 lines you would have to sacrifice maximum frequency — setting a range of 200 to 400 Hz — and stop seeing the rest of what the accelerometer can hear.
So lines of resolution matter precisely because resolution and frequency range are tied together. An analyzer that computes millions of lines almost never has to trade frequency range for resolution. That is why the best vibration analyzers run on a computer, where the ceiling is the processor and not the instrument.
3. Frequency range: the analyzer, then the sensor
The frequency range of a vibration analyzer is set by two things: the analyzer’s highest sample rate, and the maximum frequency the accelerometer can measure. The sample rate is how many measurements the system takes in one second, and the maximum frequency it can see is roughly half of that.
A system sampling at 20 kHz has a maximum frequency near 10 kHz. The intuition: for a 1 Hz signal — one cycle per second — to show its waveform, the negative half and the positive half, you have to measure at least twice per cycle.
Accelerometers have their own maximum and minimum (commonly 1 Hz to 10 kHz). Outside those limits, sensitivity drifts progressively, so measuring beyond them is not recommended.
In general, the analyzer’s range should sit above the range of conventional accelerometers. That is what gives you the freedom to connect a better sensor later without replacing the instrument.
One precision that matters when you do the arithmetic yourself: dividing by 2 gives the highest frequency the spectrum shows; dividing by 2.56 gives the highest frequency whose amplitude you can trust. The margin between the two is the anti-aliasing filter, which starts attenuating before the Nyquist limit. A 48 kHz sample rate shows a spectrum up to 24 kHz and gives accurate amplitudes up to 18,750 Hz. When you compare datasheets, check which of the two numbers the vendor is quoting.
4. The functions every analyzer should have
These are not extras. An analyzer missing several of them will send you back to a PC for the part of the work that matters:
| Function | What it is for |
|---|---|
| FFT | The spectrum is the heart of the instrument — almost every analysis function needs it. Includes measurement cursors and window functions: rectangular, Hann, Hamming, flat top |
| Time waveform | The signal as it arrives from the sensor. Used less often, but derived views such as the circular waveform reveal patterns in gearboxes and bearings |
| Measurement parameters | Acceleration, velocity, displacement, and acceleration envelope (demodulation), which is what catches bearing faults early |
| Machine database | Stores everything about your machines and every recording over time |
| Data collection | A mechanism to store and organise readings so each machine has a history and a trend. You will use this every day — an intuitive database interface is what keeps it from becoming a chore |
| Envelope alarms | Theory gives ideal levels for some machines. When you do not have one, this wraps the whole spectrum and raises an alarm as soon as any frequency grows beyond the percentage you set |
| Reporting | Building a report signal by signal is punishing. Automatic reporting is hours per month |
| Phase analysis | Requires two simultaneous channels to establish direction of motion. Mandatory for a full diagnosis of misalignment, among other faults |
| Bearing database | Bearing analysis identifies fault frequencies from bearing geometry, so you need a complete database with manufacturer data to compute them |
| Dynamic balancing | Usually optional, yet unbalance is one of the most common causes of vibration. Correcting it on the spot is the difference between diagnosing and fixing |
5. Advanced functions: where analyzers separate
These may or may not be present, and may go by other names.
ODS — Operating Deflection Shapes. Simulates the movement of the whole machine as a 3D drawing. Not common, and excellent for diagnosis: above all it is easy to understand for anyone, including people with little or no background in vibration analysis. It is also, undeniably, a tool that sells — because it is so descriptive.
Modal analysis. Impact hammer, FRF, natural frequencies. This is what tells you whether the problem is a force or a resonance amplifying an ordinary force.
Run-up and coast-down. Recording the machine while it changes speed is the cleanest way to separate a resonance from a running-speed fault.
⚠️ When a vendor demonstrates these, ask them to run it on a recording from your machine, not on the demo file. Demo files are chosen because they look good.
6. Decide where the database is going to live
Some analyzers now offer a cloud database. Sharing a database with your customers reduces the amount of reporting you have to write, and gives them the satisfaction of seeing the data themselves.
The question underneath that convenience is the one to ask out loud: when you stop paying, what happens to the history? Five years of trends is the asset the whole program exists to build. It should be exportable, and ideally it should be able to live on a server you own.
7. Verify which sensors can be plugged in
| Sensor | Output proportional to | Power | Where it is the right choice |
|---|---|---|---|
| Accelerometer | Acceleration | Required — it contains an amplifier and noise filtering | The default: excellent frequency and amplitude range, low noise. Converts to velocity and displacement in software |
| Velocimeter | Velocity | Not required — electromagnetic | Legacy installations and low-frequency work |
| Displacement probe | Displacement | Required | Non-contact. Shaft vibration and eccentricity — and the right answer on oil-film bearings, where the oil damps the vibration and makes accelerometer readings less reliable |
It is worth choosing an analyzer that can accept other sensor types. There are machines for which the accelerometer is simply not the right instrument, and discovering that after the purchase is expensive.
8. Take portability into account, but do not sacrifice power
You will handle this instrument every day, so portability is real. But a small device with little functionality is a permanent limitation, and the four form factors compared above are the concrete version of that trade-off.
The test that settles it: hold the instrument, then ask what the analysis software costs separately. A light instrument whose diagnosis happens on a PC licence you also have to buy is not a portable analyzer — it is half of one.
9. Never underestimate technical support
Nothing is ever perfect, and complex instruments need help. You will be in contact with the distributor or the manufacturer with some regularity, so:
- Cost. Is there an additional charge for support?
- Speed. How fast does the technical team actually answer?
- Spare parts. Without a backup instrument, a month of shipping is a month of your program stopped.
- Contact. Can you speak to the technical team by telephone, or is it a ticket queue?
10. Verify the price, and then the cost
Price is one of the main factors, and understanding how you will be charged is what makes it possible to plan. Four things to add up:
- Price of the system, plus the accessories, software and features you will actually need.
- Annuity. Some products carry an annual licence or support fee. Confirm it before you buy.
- Spare parts. At some point you will replace a cable, a sensor or a complete module.
- Updates. Most brands update their equipment regularly. Ask what those updates cost.
Digivibe MX®: the analyzer built against this list
A Digivibe MX® analyzer is a set, not a box. Three pieces: the software, a tablet or a PC, and the interface that gets the signal in — EI WiSER® 3X for the wireless version, or the GX-400 for the cabled one. That is the whole instrument, and it is assembled from parts you can buy, replace and upgrade separately. The full figures are on the Digivibe MX® specifications.
It is built that way because of specification 2 and specification 10 at the same time: a computer is the only platform where lines of resolution stop being a limit and where the hardware can be replaced without buying the instrument again.
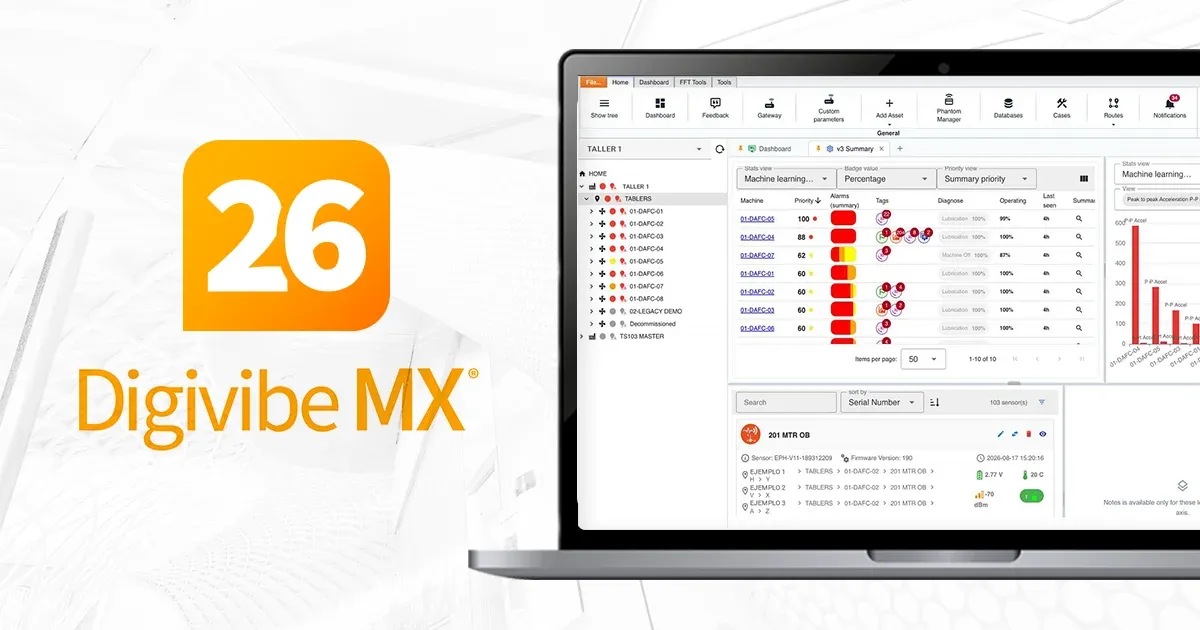
The spectrum with no ceiling on it
Digivibe MX® runs on any Windows, macOS or Linux tablet or PC, so the processor and the memory are whatever you decide to give it. That is what lets it work past two million lines of resolution without giving up frequency range — the trade-off that specification 2 is entirely about. The EI WiSER® 3X streams in real time, so the constraint is how long you record, not the instrument.
Four simultaneous channels either way, sampled at 48 kHz: the WiSER 3X sends three axes plus one additional channel at once over 10 kHz of bandwidth, and the GX-400 is a four-channel cabled interface — a triaxial plus a tachometer, or up to four single-axis accelerometers, up to 24 kHz — for the machines where a cable is still the right answer. When a machine needs more, DEFIANT™ feeds the same software with 8 or 16 channels at 96 kHz.
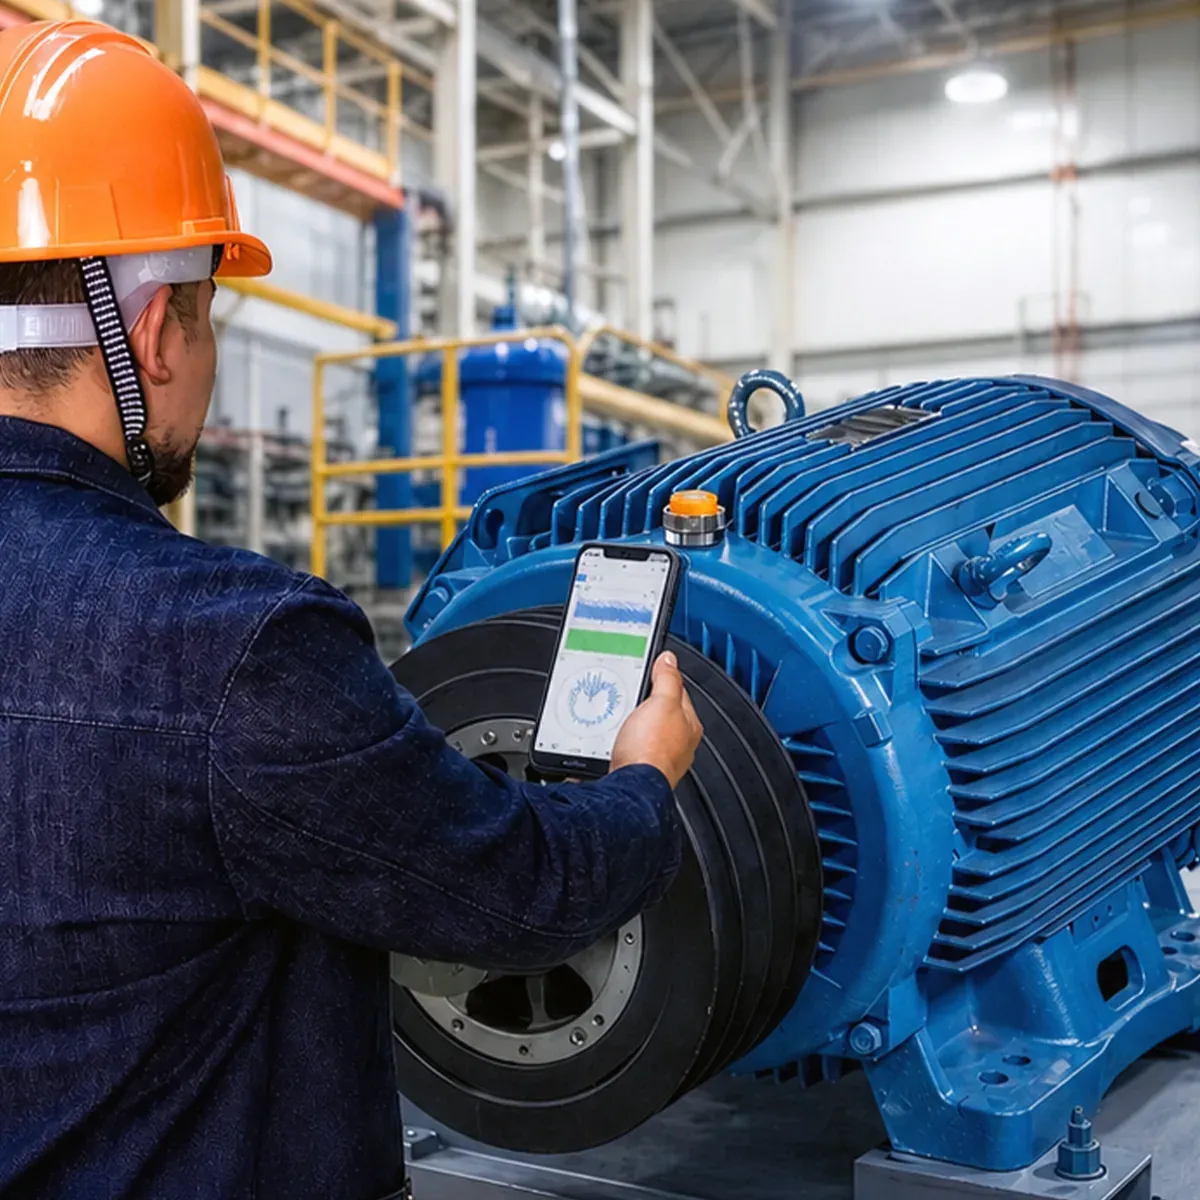
One licence, two instruments
The same Digivibe MX® licence also runs WiSER VIBE® on your phone or tablet, iOS or Android, with 4 simultaneous channels and 2 million lines of resolution. Not a viewer: the licence unlocks the advanced functions inside the mobile app too — two-plane, three-plane, the Balancing Wizard and the four-run method.
So the same purchase gives you two instruments for two different days. Walk the route with a phone and a wireless sensor in one hand, come back and open the same database on the tablet for the deep analysis. Balance on site with whichever of the two you happen to be carrying.
That is what specification 8 was really asking for, and it is why we think this is the most practical arrangement on the market: you stop choosing between portability and power, because you own both.
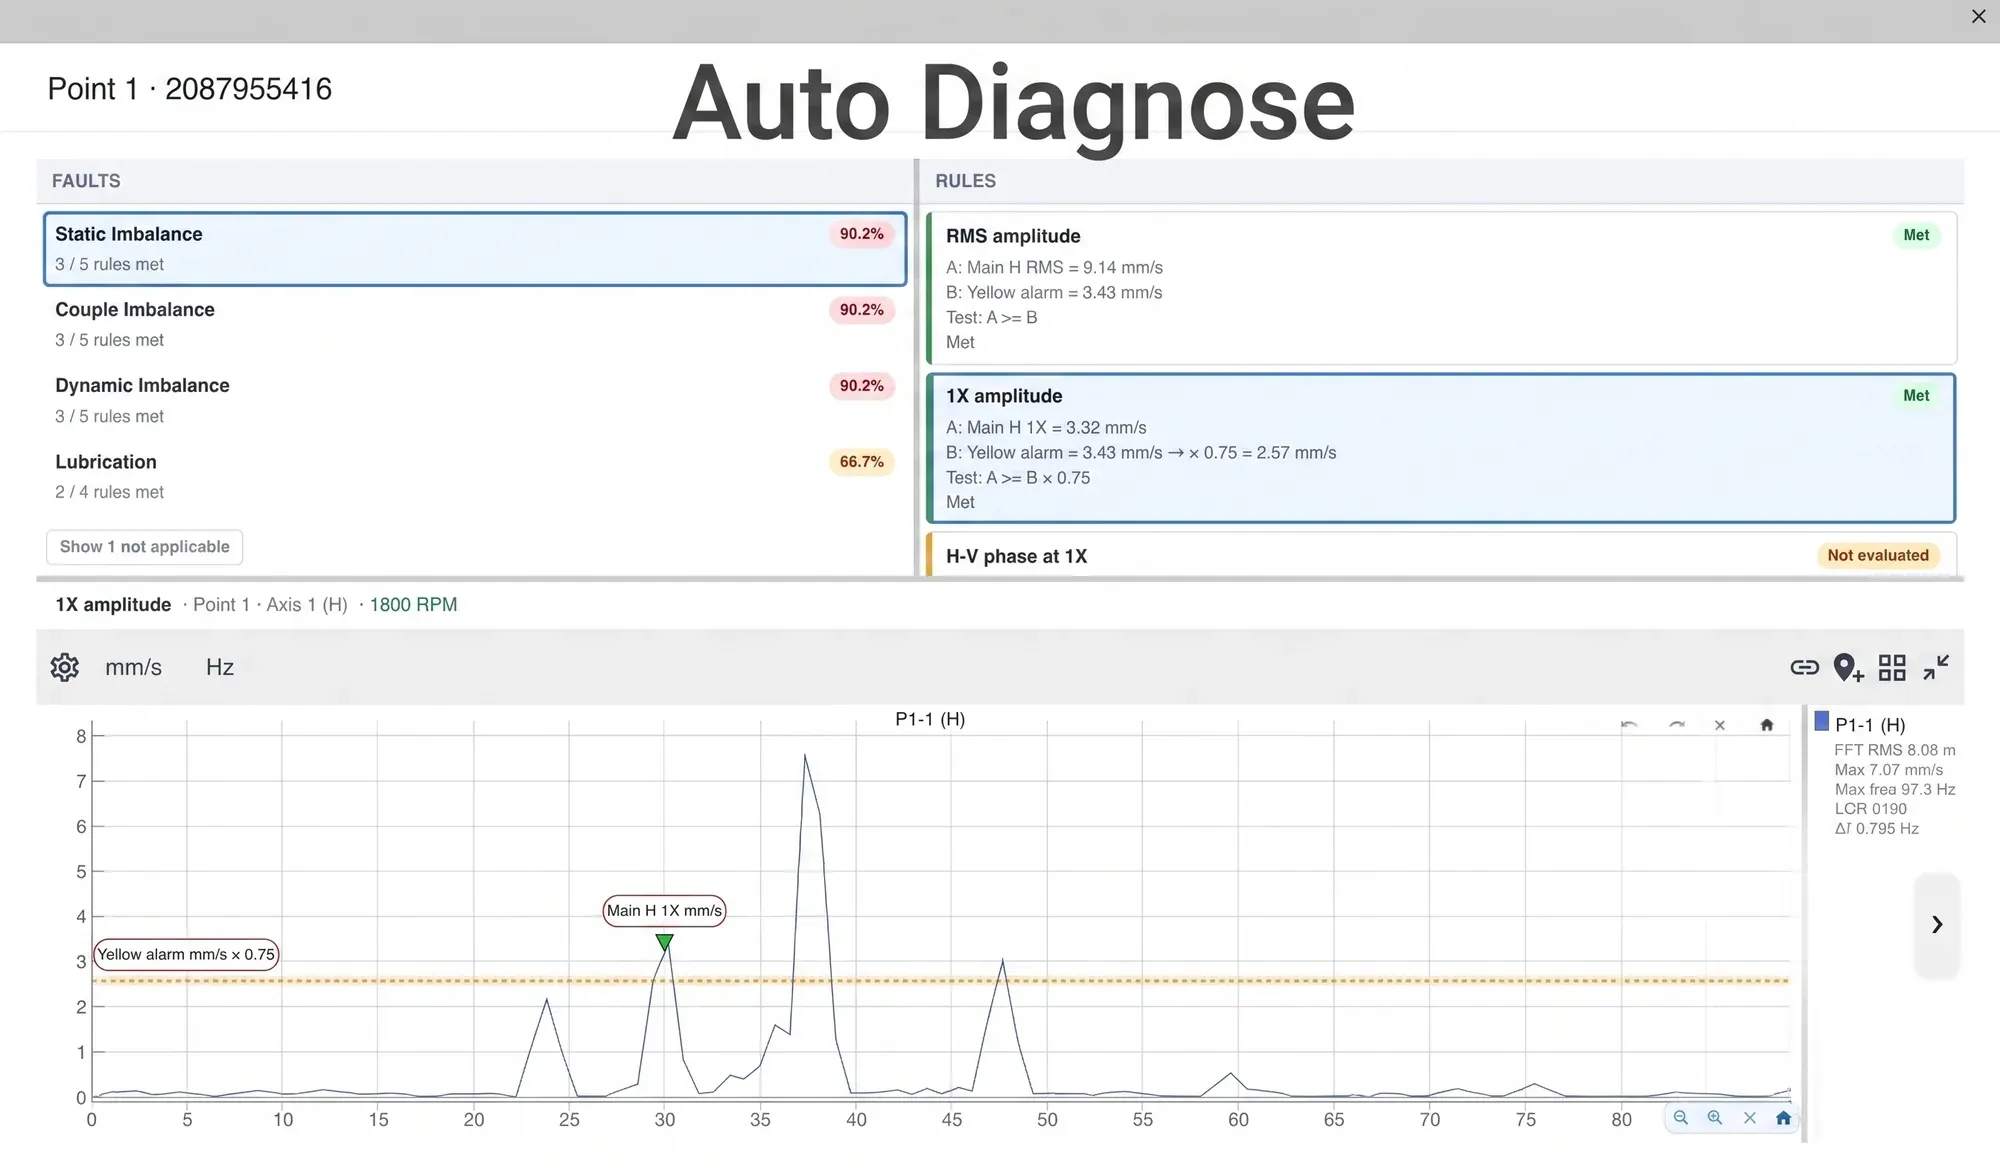
It names the fault, not just the level
Specification 4 is a list of functions. What you actually want from them is a name. Digivibe MX® carries the FFT tools, the time waveform, the acceleration envelope, the bearing database and the envelope alarms — and then uses them to state the fault and the probability it assigns to it, so the spectrum becomes the evidence rather than the whole answer.
And on specification 6: the database can live on your own server — SQL Server or MySQL — in our cloud, or in both. The history is yours either way.
Where it is not the right fit
Two cases, stated plainly:
- If all you need is a number. If the job is to walk past forty machines and record overall RMS against an ISO band, a vibration meter does that for a fraction of the price and you do not need any of this.
- If nobody will ever open the spectrum. An analyzer that nobody uses is an expensive meter. If there is no analyst and no plan to train one, the honest recommendation is permanent sensors with automatic diagnosis — that is the monitoring system conversation, not this one.
FAQs about choosing the best vibration analyzer
What is the best vibration analyzer?
The one that meets the ten specifications in this guide without limiting you later, and for most plants that means an analyzer that runs on a phone, tablet or PC. Judge any candidate, ours included, on the same list: four simultaneous channels, lines of resolution that never force you to narrow the frequency range, a range above your accelerometers, the core functions included in the price, a database you can host yourself, more than one sensor type, telephone support, and a five-year cost known in writing. Of the four form factors, only the phone/tablet/PC one lets you replace the processor, the memory and the screen without buying the instrument again. That is how Digivibe MX® is built. We make it, so weigh that when you read our answer.
What is the difference between a vibration meter, a vibration analyzer and a data collector?
A vibration meter gives you a number, an analyzer gives you the spectrum, and a data collector gives you the history. A meter reports overall RMS and sometimes an ISO severity band, which tells you something changed but not what. An analyzer computes the FFT, so the fault has a frequency and therefore a name. A data collector is an analyzer with a machine database and routes, so each reading is compared with the previous ones and you can see a fault developing rather than discovering it.
How many channels does a vibration analyzer need?
Four. Two simultaneous channels are enough for balancing in one plane, phase analysis, Bode plots and ODS. Four are required for a triaxial accelerometer or for balancing two planes at once. Single-channel analyzers cannot perform the techniques that misalignment, Bode and balancing need. Confirm that the channels record simultaneously rather than being multiplexed: two signals recorded a moment apart carry no usable phase relationship.
How many lines of resolution do I need in a vibration analyzer?
Enough that you never have to reduce the frequency range to get resolution. Lines of resolution divide the frequency range, so the same count gives ten times the resolution over 1,000 Hz that it gives over 10,000 Hz: 6,400 lines over 10,000 Hz is 1.56 Hz per line, and over 1,000 Hz it is 0.156 Hz. When two frequencies sit close together — a fan and a motor on similar pulleys — you need them to appear as separate peaks. Ask for the maximum lines of resolution at the maximum frequency range, which is the number that decides it.
What frequency range should a vibration analyzer cover?
Above the range of the accelerometers you plan to use, so the sensor is the limit and not the instrument. Conventional accelerometers measure accurately from about 1 Hz to 10 kHz; outside those limits sensitivity drifts and readings are not reliable. An analyzer with more range than that gives you the freedom to connect a better sensor later without replacing the instrument.
Why do datasheets divide the sample rate by 2.56, and not by 2?
Because the two numbers answer different questions. Half the sample rate — the Nyquist frequency — is the highest frequency the FFT can show, so a spectrum from a 48 kHz recording reaches 24 kHz. But the anti-aliasing filter has to start attenuating before that edge, so amplitudes near it are already reduced. The industry convention is that the amplitude is reliable up to the sample rate divided by 2.56 — 18,750 Hz in the same example. An instrument that quotes its Fmax as the sample rate divided by 2 is not wrong: it is telling you where the spectrum ends, not where the amplitude stops being trustworthy. Ask for both.
Is a single-channel vibration analyzer enough?
No, for anything beyond screening. A single channel cannot do phase analysis, which needs two signals recorded at the same instant to establish the direction of motion. Without phase you cannot fully diagnose misalignment, you cannot build a Bode plot and you cannot balance properly. Single-channel instruments have largely disappeared from the professional market for this reason.
Which sensor should I use: accelerometer, velocimeter or displacement probe?
An accelerometer, unless the machine has oil-film bearings. Accelerometers cover the widest frequency and amplitude range with the lowest noise, need a power supply because they contain an amplifier, and convert to velocity and displacement in software. Velocimeters are electromagnetic and need no power. Displacement probes are non-contact and are the right answer on oil-film bearings, where the oil damps the vibration and makes accelerometer readings less reliable, and for shaft eccentricity.
Should a vibration analyzer also do dynamic balancing?
If you intend to correct and not only diagnose, yes. Unbalance is one of the most common causes of vibration in rotating machinery, and balancing is usually sold as an optional module. The question to ask is not whether the instrument can balance but what the module costs and how many planes it supports — one plane, two, or three.
What does a vibration analyzer cost, and what else do I pay for?
The invoice is not the cost. Four items decide the five-year number: the system with the accessories and software you will actually need; an annual licence or support fee, where one applies; spare parts, because cables, sensors and modules do get replaced; and updates, which some brands charge for. Ask for all four in writing before you compare two quotations, because an instrument that looks cheaper on the invoice can be the expensive one by year three.
How do I know whether an analyzer can detect bearing faults early?
Look for acceleration envelope, also called demodulation. Early bearing damage produces small, repetitive impacts whose energy sits far above the running-speed frequencies, and it is buried in the ordinary spectrum. The envelope technique isolates that band and makes the impact frequency visible while the overall level is still normal. An analyzer without envelope will find the bearing fault, but later — and a complete bearing database is what turns that frequency into the name of the damaged part.
Further reading